Analysis

Ethereum [ETH] likely to face a wall of sellers at $1700 – Can the bulls prevail?
Posted:
Journalist

Disclaimer: The information presented does not constitute financial, investment, trading, or other types of advice and is solely the writer’s opinion
- Buying pressure saw ETH surge to the doorstep of a major resistance yet again
- Buyers can wait for a breakout, while short sellers could be swimming against the tide
The V-shaped reversal of Ethereum on the price charts on Monday rewarded buyers handsomely, but it has not formed any consolidation on the way up. This is not a problem in itself, but it seemed to present some uncertainty for buyers looking to enter the market.
Read Ethereum’s [ETH] Price Prediction 2023-24
The large swathes of imbalances to the south might get tagged before another leg upward. On the other hand, the price could shoot past $1700 this week. Which scenario can a buyer look to profit from, and how?
Violent reversal saw ETH nearly scrape the range highs once more
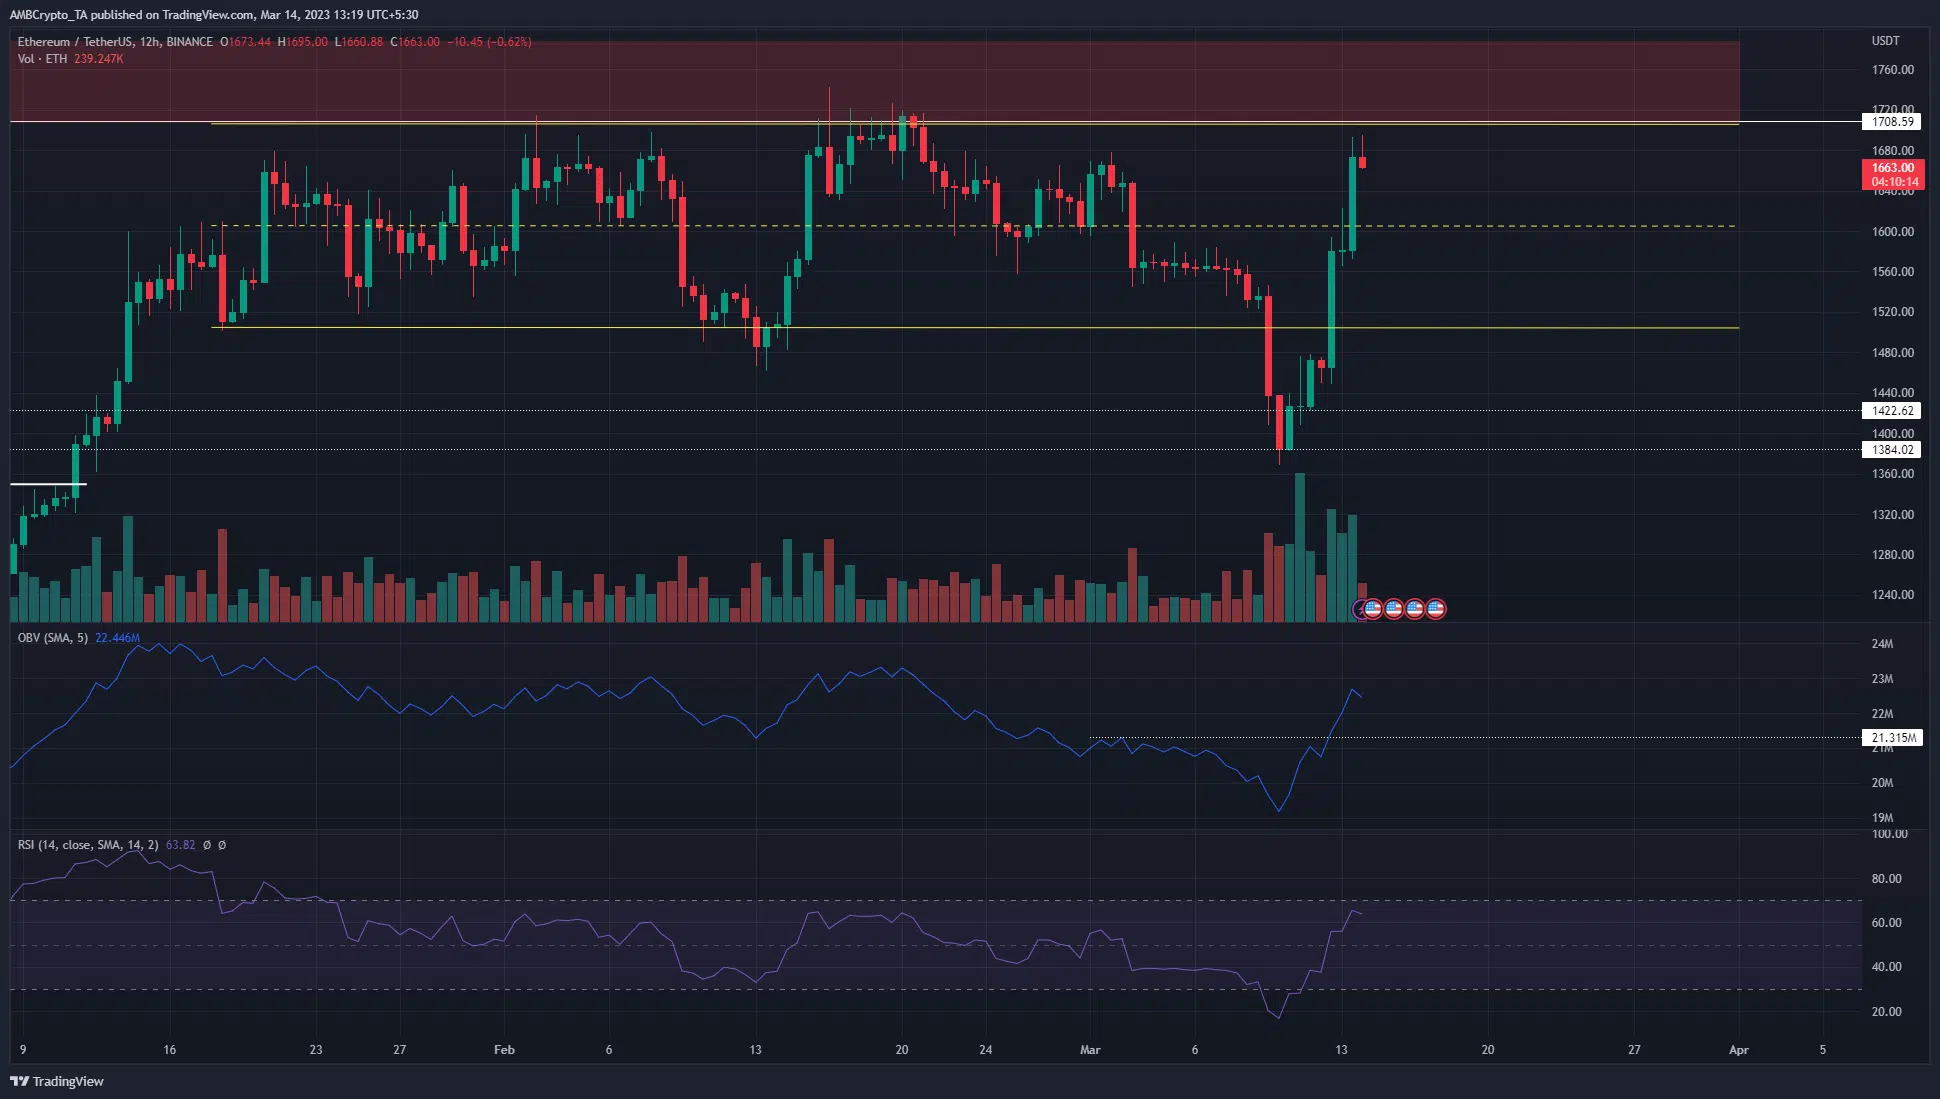
Source: ETH/USDT on TradingView
The strong buying pressure meant that the fall beneath the range low at $1500 was invalidated within the space of three days. Generally, the sharp fall beneath the range (yellow) and a subsequent retest of the lows would be a selling opportunity. However, the OBV showed there was heavy buying volume over the weekend and Monday.
This saw Ethereum burst past the $1500 and $1600-levels, pausing for a few hours in the $1600 zone. This seemed to be the mid-range mark. To the north, the $1700-1750 zone will likely pose resistance to the prices.
Hence, any ETH buyers can look to book profits around this area and wait for a breakout and retest before buying. Short sellers would be selling against the trend and might take on extra risk if they’re not cautious with position size.
Is your portfolio green? Check the Ethereum Profit Calculator
The RSI and the OBV both showed strong bullishness. The RSI was well above neutral 50 and this could begin an uptrend, provided $1700 is broken. Once the $1750-area is flipped to support, the next higher timeframe resistance lay at $2000.
In case of a retracement, buyers can be on the lookout for a break in structure on lower timeframes such as H4 to exit their trades and limit their losses.
MVRV ratio leaps higher but selling pressure might not have ended
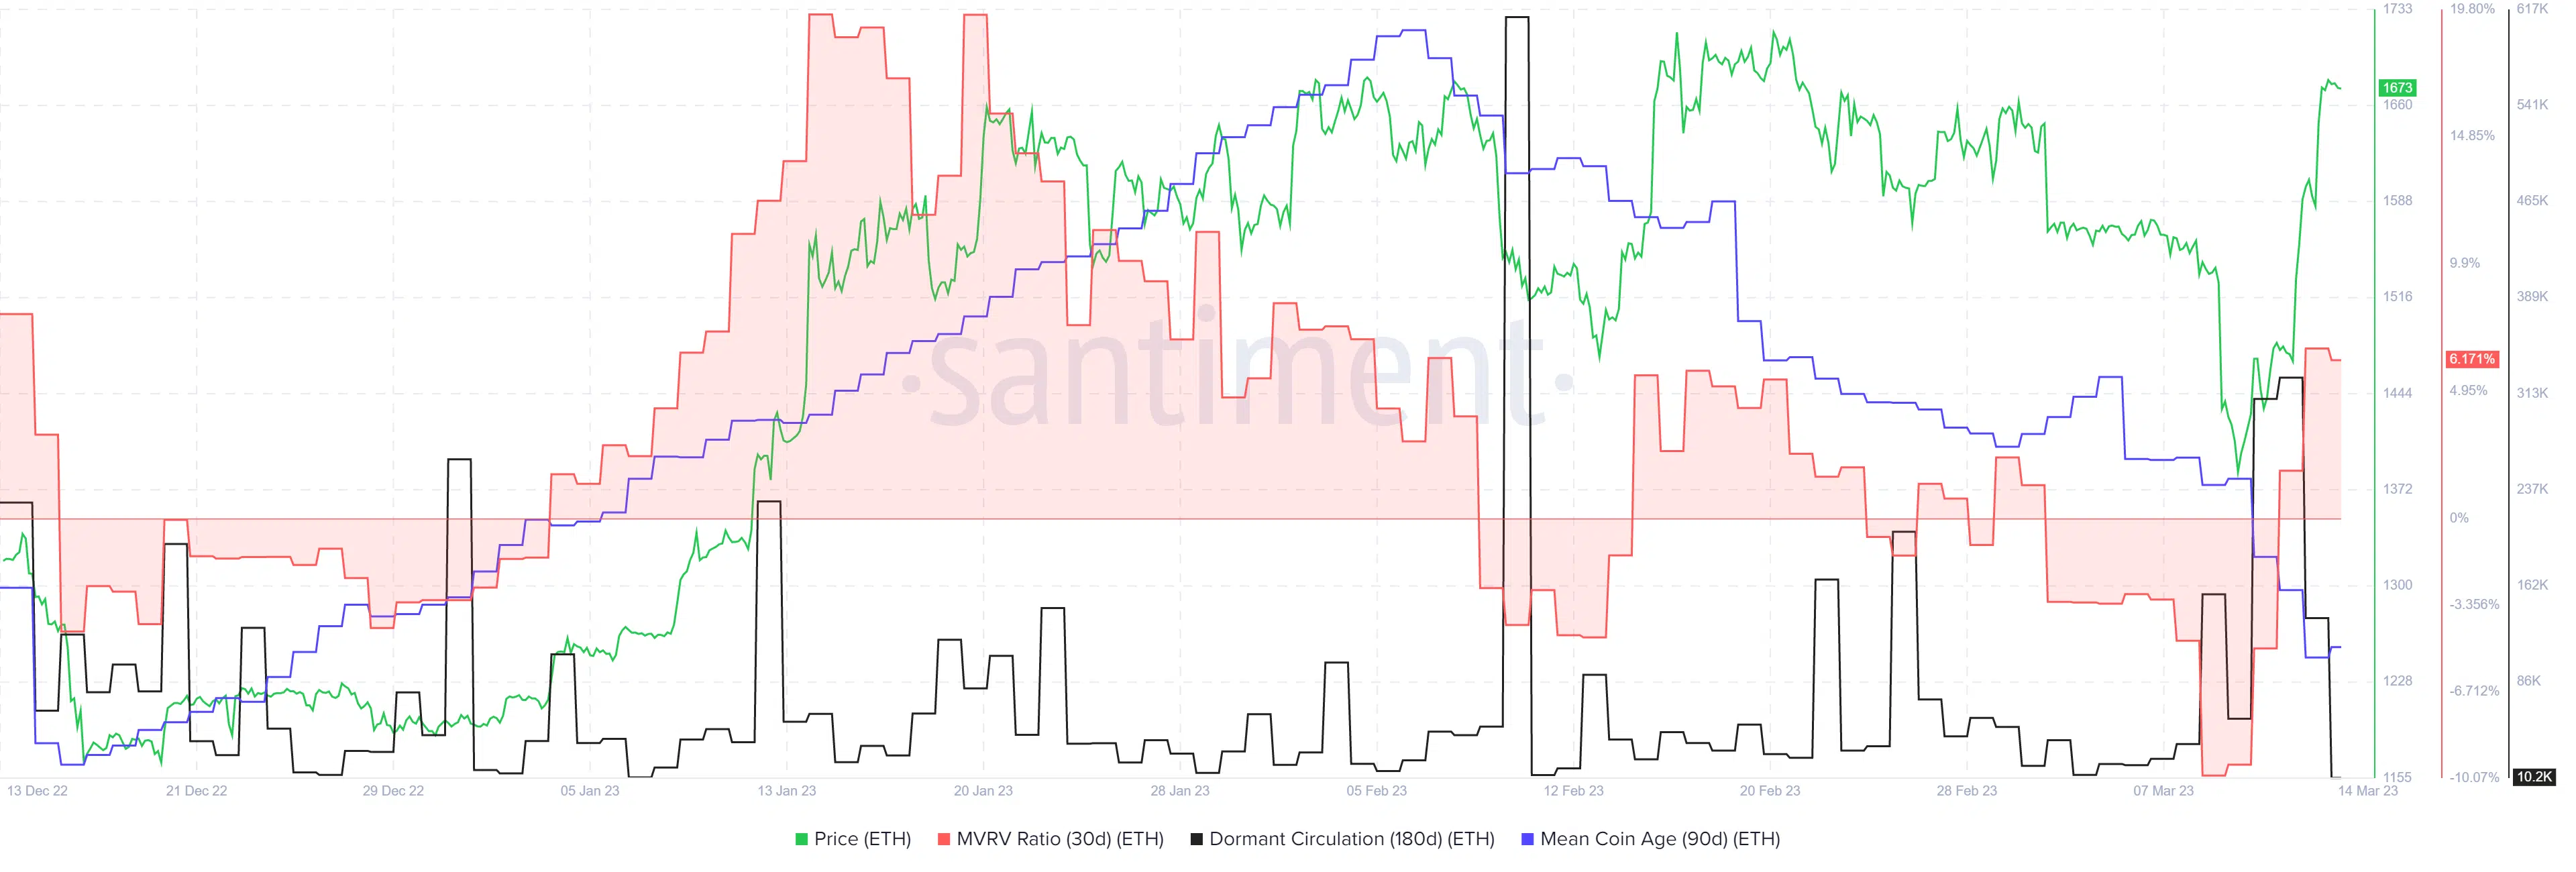
Source: Santiment
The 30-day MVRV ratio picked itself up from its 3-month lows and was back in positive territory once more, at press time. This suggested short-term holders were in profit. However, the 180-day dormant circulation metric saw a large spike on 12 March.
The mean coin age of Ethereum has also been in decline since mid-February. This was a sign of greater token movement between addresses. It also seemed to be a sign that the distribution phase after the run upward in January is still not over.