
Disclaimer: The information presented does not constitute financial, investment, trading, or other types of advice and is solely the writer’s opinion
- The H4 market structure remained bearish.
- The daily chart showed that $1350 and $1280 could see some relief from the selling.
News that Voyager was liquidating its Ethereum holdings saw the bearish pressure intensify in the crypto market. On-chain analysis showed they were partly responsible for the sell-off seen in March.
Is your portfolio green? Check the Ethereum Profit Calculator
On the price charts, there was no respite yet from the bearish momentum. The sellers were utterly dominant, although bulls have seen some small joy over the weekend. This was unlikely to reverse the downtrend.
Yet another imbalance on the chart, but will this one be filled?
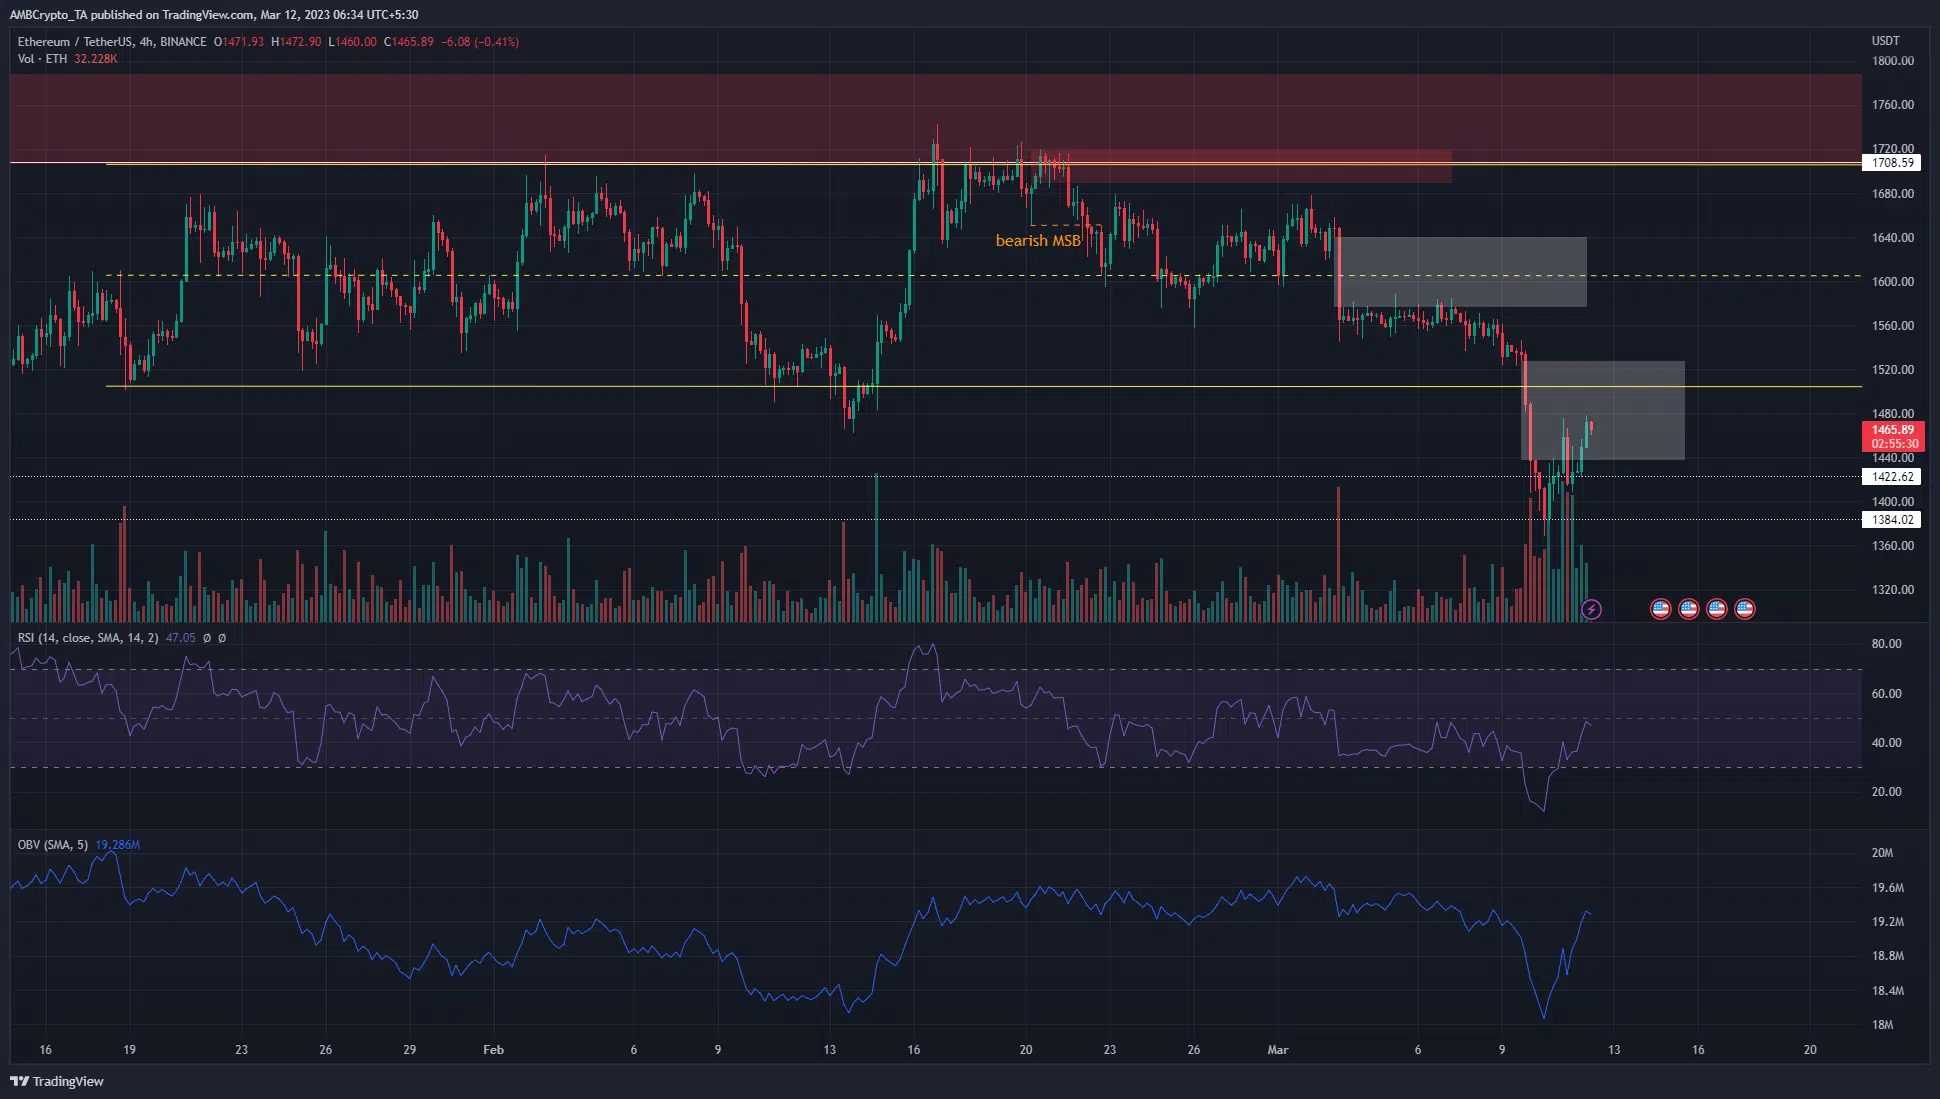
Source: ETH/USDT on TradingView
The sharp drop on 3 March left a large imbalance on the 4-hour chart, highlighted in white. Similarly, another fair value gap was presented last week when Ethereum dived from $1527 to $1437, and both imbalances were highlighted in white.
The first one did not see a meaningful fill, but the latter gap is close to seeing 50% filled, which would be at $1482. Moreover, the $1475-$1480 area has acted as resistance over the 24 hours preceding press time.
The RSI appeared to retest the neutral 50 as resistance at the same time the price neared a lower timeframe resistance band. Yet, this could easily result in Ethereum moving higher to $1500, as weekends tend to see volatility without trading volume. Meanwhile, the OBV saw a resurgence to highlight some buying pressure.
Realistic or not, here’s Ethereum’s market cap in BTC’s terms
The market structure remained bearish on both the 4-hour and the daily chart, and ETH is likely to sink toward new lows. $1420 could provide some lower timeframe support. Beneath $1400, the $1280 level could also see demand arrive.
The liquidation cascade saw $44 million longs wiped out in a matter of hours
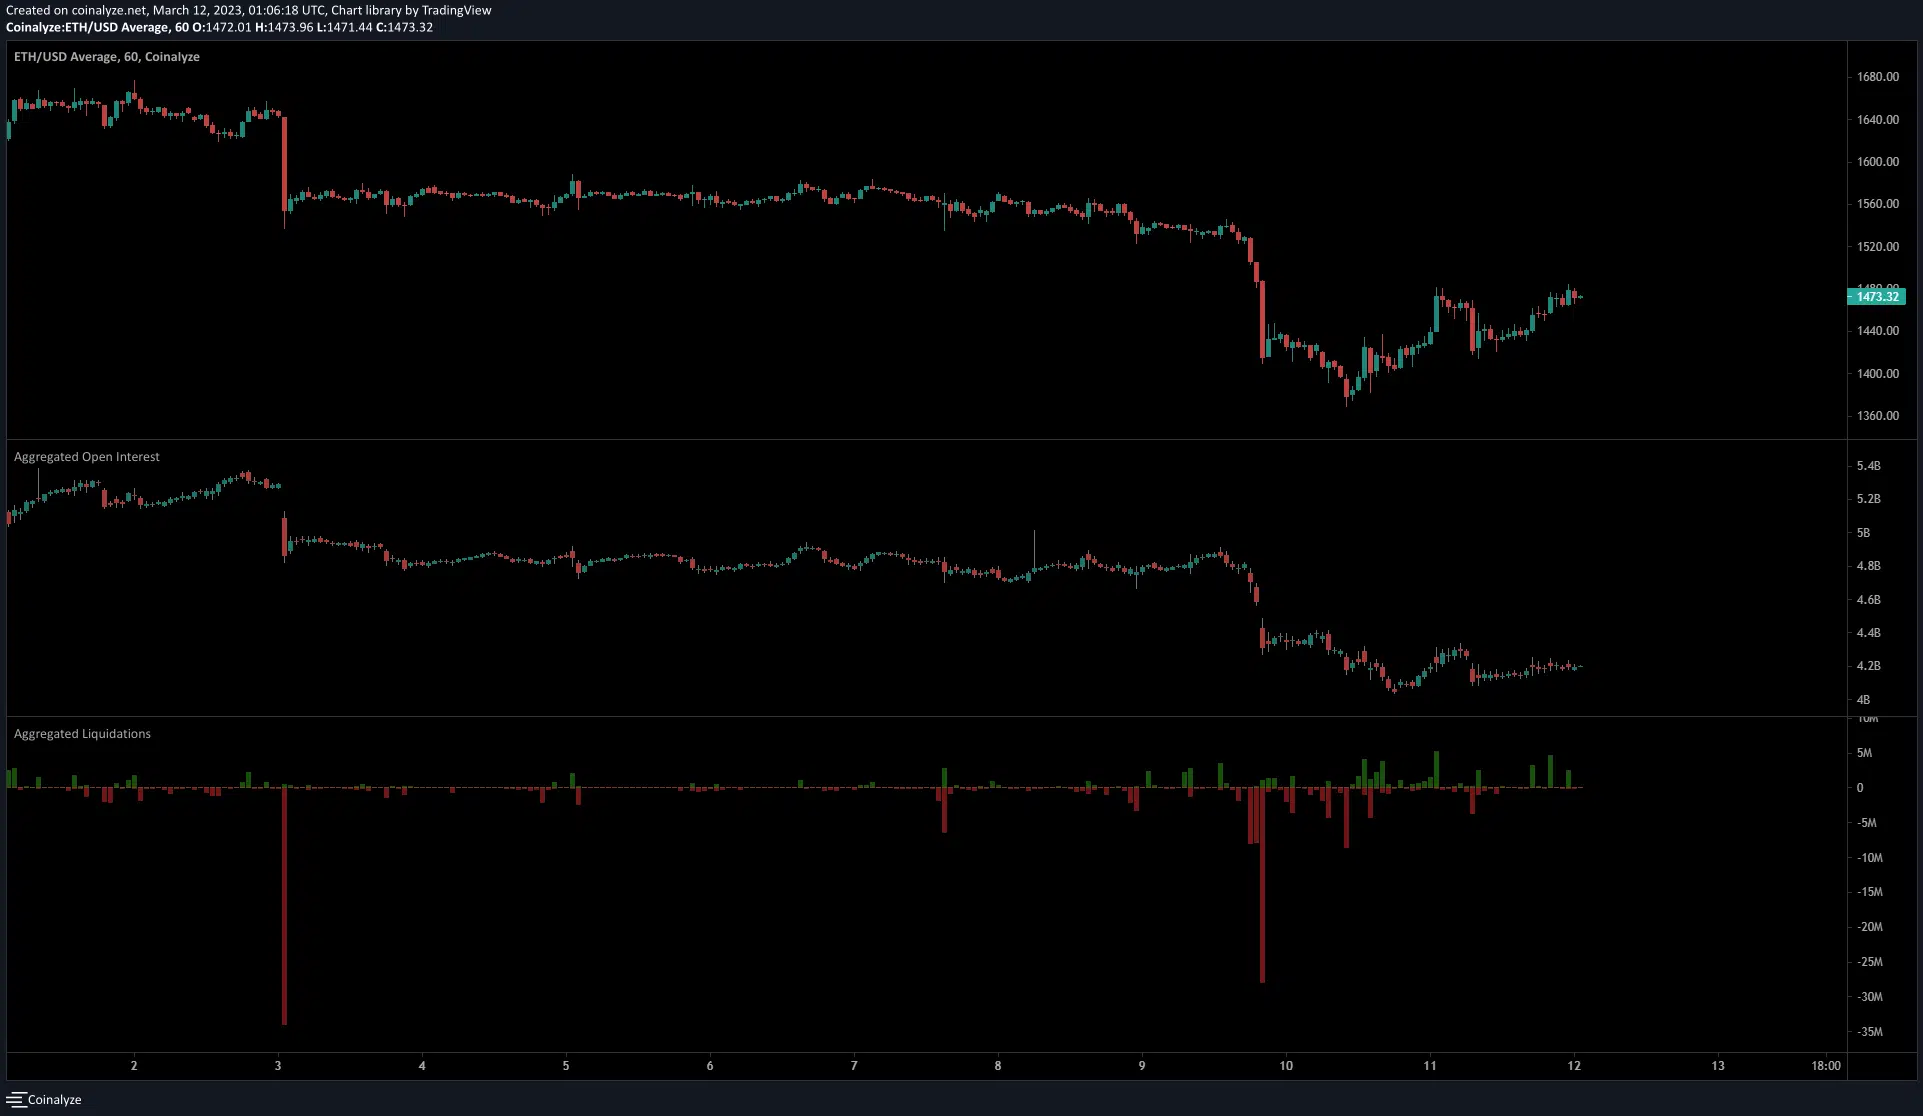
Source: Coinalyze
On 9 March, Ethereum dropped from $1525 to $1415 within the space of three hours. During this period, Coinalyze data showed that $44 million worth of long positions were liquidated. Later, the price fell to $1368 but has posted a bounce on the charts since then.
Even though this bounce measured gains of 6.5%, the Open Interest was in decline. This showed strong bearish sentiment remained in the market and was not swayed by the meager bounce.