Altcoin

Going short on SOL? The latest price action may convince you to think twice
Posted:
Journalist

- Following FTX’s collapse, traders since took to shorting SOL.
- While price might be up in the last 24 hours, outlook still appears bearish.
With the last few days marked by a decline in Solana’s [SOL] price, on-chain data revealed that short traders have persistently bet on a continued fall in the alt’s price.
Per data from CoinMarketCap, SOL’s price fell by over 60% between 19 and 22 November, and this decline led many to take trading positions against the alt’s price.
Read Solana’s [SOL] price prediction 2023-2024
Data from on-chain analytics platform Santiment revealed that SOL short trading began shortly after the collapse of FTX. Furthermore, a sense of FUD gained ground in the market as regards the extent of Solana’s exposure to FTX’s fallout. On 10 November, SOL recorded a massive short on Binance as funding rates fell significantly below -1.5%.
? There are not a lot of big #Solana believers, even as its price bottomed out at $11.02 and rebounded to $12.70 over the past 15 hours. This #FUD could cause more rebounding until traders slow down their nearly unanimous bets against $SOL's price. https://t.co/e2jSAmLEqf pic.twitter.com/1qisr8inaj
— Santiment (@santimentfeed) November 23, 2022
However, SOL’s 13% rally in the last 24 hours and data from Santiment revealed that investors’ sentiment turned positive. Should SOL continue to rebound, traders against the alt would be inevitably plunged into losses.
As noted by Santiment, the FUD in the market “could cause more rebounding until traders slow down their nearly unanimous bets against $SOL’s price.”
A token for your SOL
At the time of press, SOL’s price was up by 13% in the last 24 hours. With $667 million worth of SOL traded in the last 24 hours, its trading volume was also up 58%.
Furthermore, the positive rally in SOL’s price and trading volume in the last 24 hours was indicative of positive conviction that trailed the coin. However, movements on the daily chart revealed that sellers overpowered buyers on the daily chart.
Between 9 and 22 November, SOL’s Relative Strength Index (RSI) rested below the 30 mark. This showed that since FTX collapsed two weeks ago, the significant decline in buying pressure caused the alt to be oversold.
However, the price rally in the last 24 hours changed the RSI trend. While still far from the 50 neutral spot at press time, it was positioned in an uptrend at 31.97. This showed that buying momentum was starting to climb, albeit significantly slowly.
With coin distribution still underway, a look at the Exponential Moving Average (EMA) position revealed that the 20 EMA (blue) was below the 50 EMA (yellow) line. This depicted the strength of the sellers in the market over those who were accumulating.
Lastly, the Directional Movement Index (DMI) showed the sellers’ strength (red) at 34.89, resting solidly above the buyers’ (green) at 11.11.
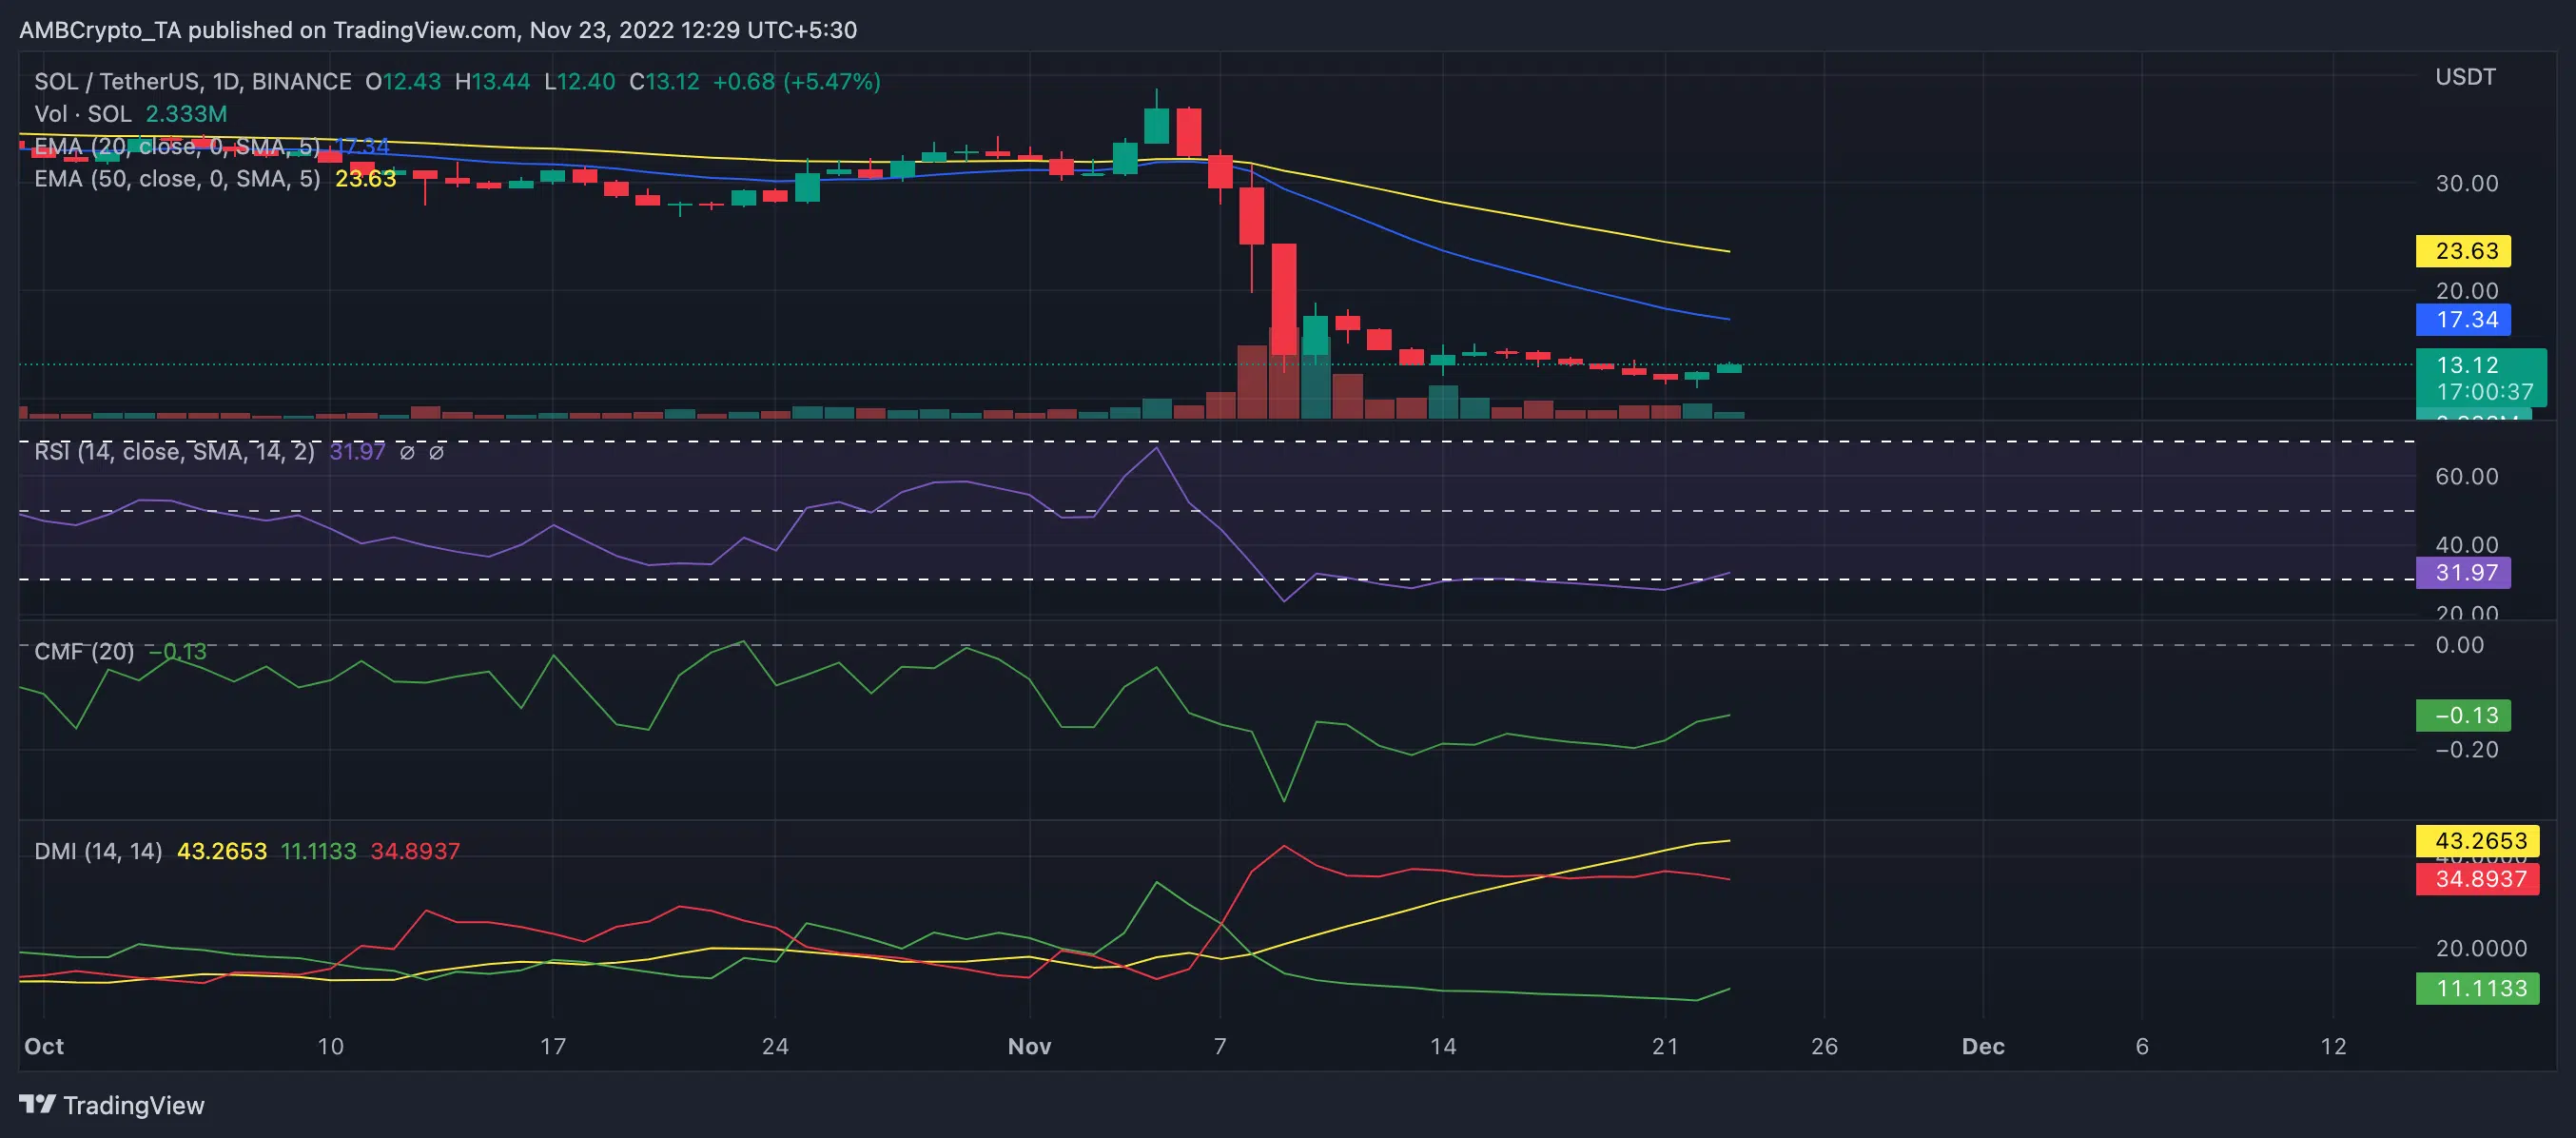
Source: TradingView


![Why Chainlink [LINK] and Polygon [MATIC] are more similar than you realise](https://ambcrypto.com/wp-content/uploads/2024/04/Chainlink_and_Polygon-1-400x240.webp)